Bitcoin Retests $108,000, But Holders Disagree On Direction


As Bitcoin pushes back toward the $108,000 level, on-chain data reveals the investor cohorts are still divided in their accumulation behavior.
Bitcoin Accumulation Trend Score Shows Mixed Behavior From Holders
In a new post on X, the on-chain analytics firm Glassnode has talked about how the BTC investor cohorts aren’t showing a unified behavior on the Accumulation Trend Score . The Accumulation Trend Score refers to an indicator that basically tells us whether Bitcoin holders are accumulating or not. The metric bases its value on two factors: the balance changes happening in the wallets of the investors and the size of those wallets.
When the value of the indicator is greater than 0.5, it means the large holders (or a large number of small hands) are leaning toward net accumulation. The closer the score is to 1.0, the stronger the buying. On the other hand, the metric being under the threshold suggests the investors are in a phase of distribution (or simply, that they aren’t accumulating). This behavior is the strongest at the zero mark.
Now, here is the chart for the Accumulation Trend Score shared by Glassnode, showing the trend in the metric separately for the various holder groups:

As displayed in the above graph, the Accumulation Trend Score has recently varied in value across these cohorts. Investors who hold between 1 to 10 BTC appear to be distributing, while those with 10 to 100 BTC are accumulating.
Among the large holders, the trend leans more neutral, but the indicator still doesn’t show any clear uniformity. Members of the 1,000 to 10,000 coins group, popularly referred to as the whales , are currently tending toward accumulation, but those part of the 10,000+ cohort, the ‘ mega whales ,’ are showing slight distribution.
According to the analytics firm, the Accumulation Trend Score of the network as a whole stands at 0.57. As such, it seems there is no majority behavior being followed by the traders at the moment.
That said, while a unifying buying push hasn’t appeared alongside the latest price rally toward $108,000, there has still been an improvement that has occurred in the score. According to the analytics firm, the indicator dropped to a low of 0.25 earlier.
It only remains to be seen, however, whether the Bitcoin investors would continue to move in this direction, or if indecision is here to stay for a while.
BTC Price
Bitcoin attempted to find a break above the $108,000 level earlier, but the asset has so far not been able to maintain a sustainable move, and its price has even seen rejection toward $107,100.


World Liberty Financial Receives $100 Million from UAE Crypto Investment
A fund based in the United Arab Emirates (UAE) has announced a significant investment of $100 millio...

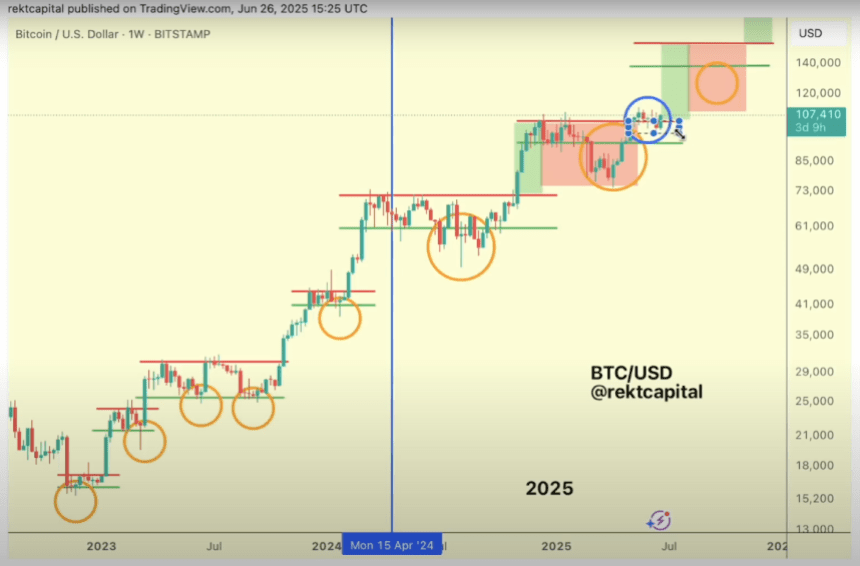
Bitcoin Next Price Discovery Coming? Analyst Shares BTC’s 2025 Roadmap
This week, Bitcoin (BTC) has recovered from its recent drop below the $100,000 level and is attempti...

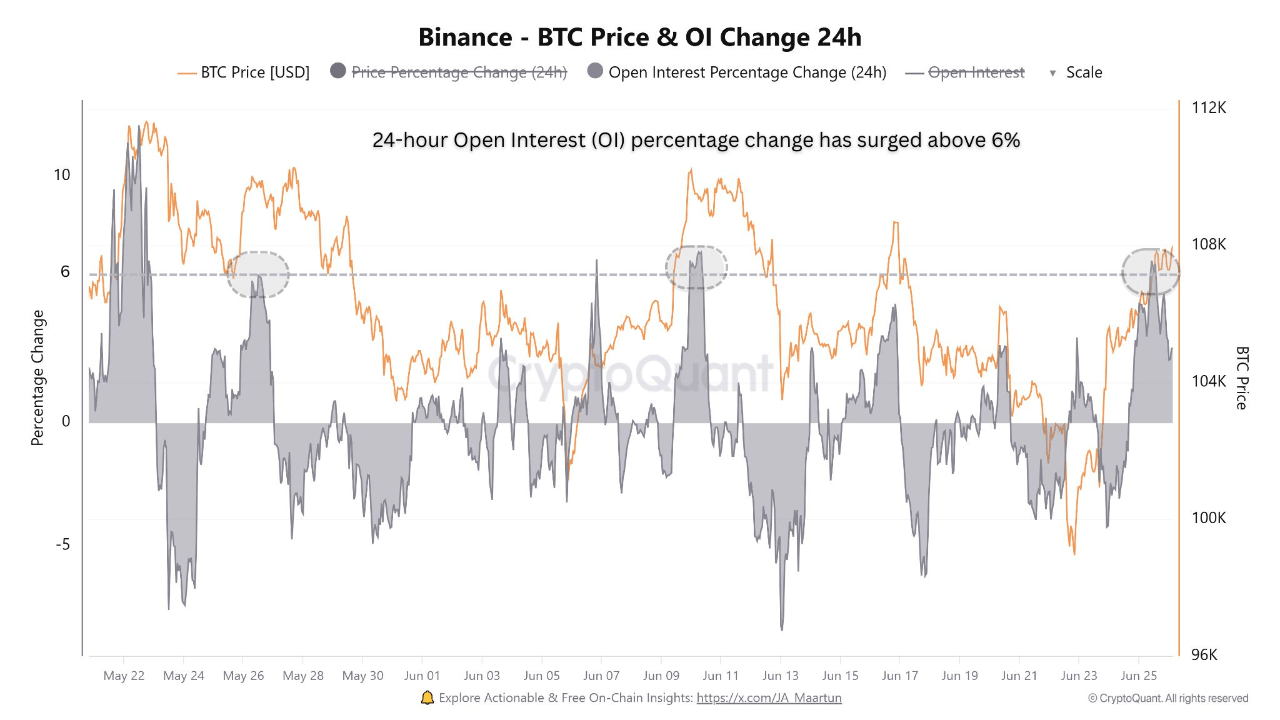
Bitcoin Binance Open Interest Shoots Up: Warning For BTC?
Data shows the Bitcoin Open Interest on the cryptocurrency exchange Binance has recently shot up. Wh...

