Bitcoin Technical Indicators Signal Strong Buy as Price Eyes $116,000 Target


Bitcoin's technical indicators are flashing strong buy signals across multiple timeframes, with analysts targeting potential price moves toward $116,000 as the cryptocurrency maintains its upward trajectory.
TradingView's BTCUSD technical analysis Bitcoin summary, which studies the most widely used technical indicators, including moving averages, oscillators, and pivots, shows a 'buy.'
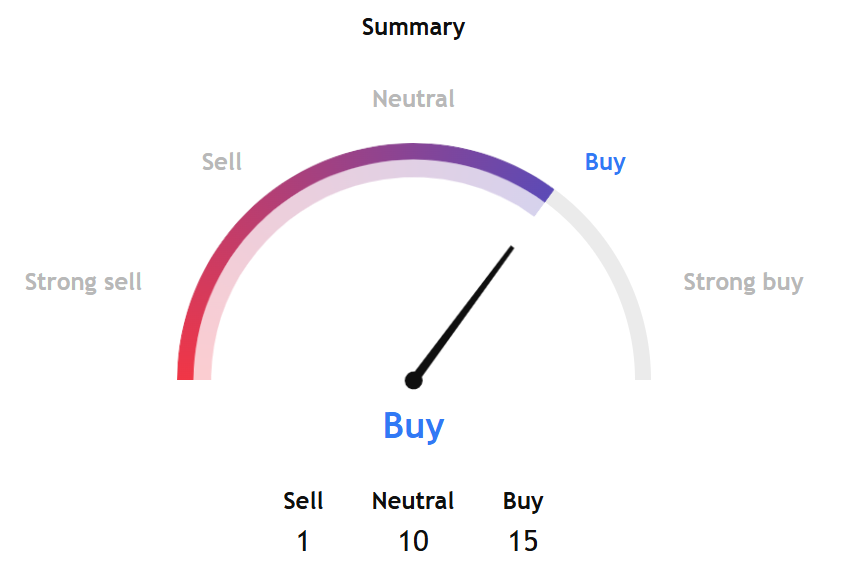
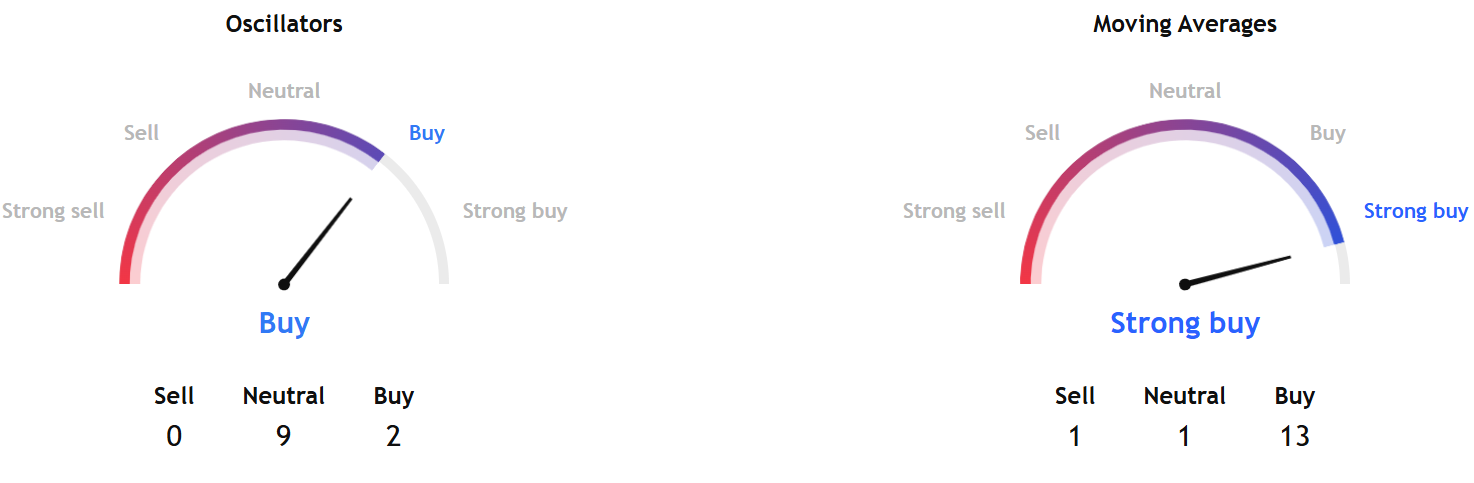
The summary of oscillators points to a 'buy' signal, and moving averages show a 'strong buy' for Monday. The only sell signal comes from the Hull Moving Average (9) indicator under the moving averages set.
For the month ahead, TradingView's BTCUSD technical analysis Bitcoin summary shows a more positive reading, with a 'strong buy' reading.
InvestTech's overall algorithmic analysis gives a positive score, with the overall assessment for Bitcoin as technically positive in the short, medium, and long-term timeframes. The firm notes that Bitcoin has broken out of an approximate horizontal trend channel after sustained buying pressure drove prices higher. The platform identifies that Bitcoin's rectangular price structure has been broken, setting up conditions for further gains.
An additional surge to $116,074 or higher is imminent. At $110,000, the currency is seeing resistance. This level may cause a negative reaction, but if it breaks above $110,000, a new ATH and beyond is a reality.
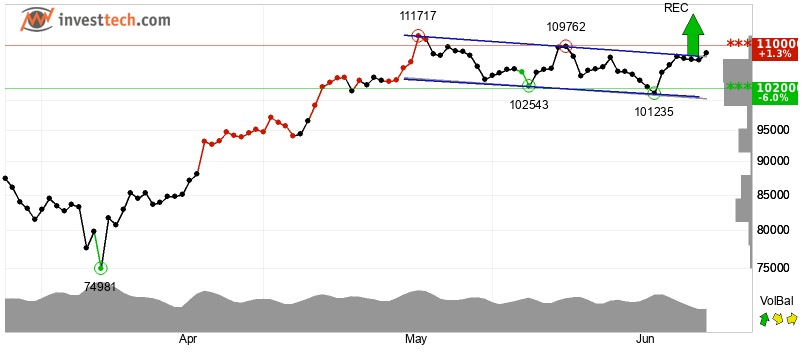
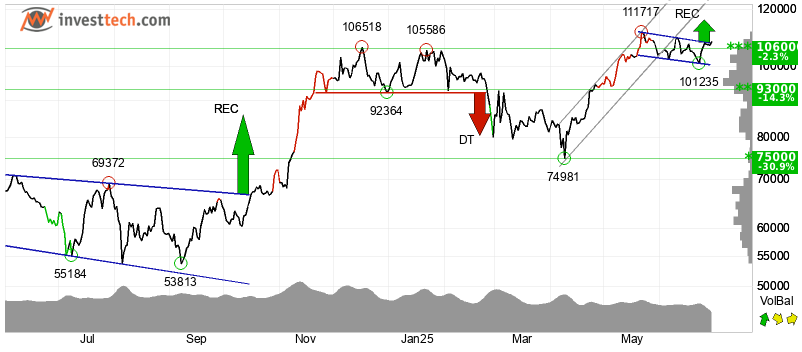
The technical picture shows Bitcoin has pierced through the medium-term rising trend channel's floor, suggesting an initial slower growth rate before acceleration. The cryptocurrency broke through a rectangle pattern barrier at $108,003 and surpassed a key resistance level at $106,000, both of which InvestTech views as bullish continuation signals.
Supporting the technical outlook, ETF flow data from SoSoValue shows institutional demand remains robust. Daily total net open interest delta – difference between the daily movements of open contracts for calls and puts – reached $44.22 million, indicating increased call option activity that typically requires market makers to hedge with underlying assets, which usually means more ETFs.
Bitcoin ETF net flows totaled $501.27 million as of June 27, bringing cumulative net inflows to $48.87 billion since launch. The funds now hold $133.17 billion in total net assets, representing 6.25% of Bitcoin's total market capitalization.
The strong ETF inflows complement the technical signals by providing sustained institutional buying pressure that could help drive Bitcoin through key resistance levels in the coming sessions.
The combination of bullish chart patterns, positive momentum indicators, and continued institutional inflows through ETFs creates a favorable environment for Bitcoin's next leg higher, with the current all-time high representing the immediate technical target to watch.

Bitcoin Needs a Bigger Push to Scale ATH
S&P 500 hits new record high as Bitcoin surges past $108,500 in strongest cross-asset rally since Ma...

Zodia Completes Acquisition of UAE Digital Asset Custodian Tungsten
Bank-backed platform gains ADGM license and expands Middle East presence through regulated custodian...

The Blockchain Group Acquires 60 BTC, Reports 1,270% YTD Bitcoin Yield
European bitcoin treasury company reports €46.7 million in bitcoin gains year-to-date as holdings re...