Bitcoin Eyes $120K? Analyst Reveals What Comes After BTC’s 50-Day EMA Breakout


Bitcoin has resumed its upward movement, maintaining strength above the $107,000 level as market momentum builds toward the asset’s recent all-time high above $111,000. As of this writing, BTC is trading at $107,242, reflecting a 1.3% gain over the past 24 hours and a 2.7% rise in the past week.
The market’s rebound comes after a brief dip last weekend, suggesting that investor confidence remains resilient heading into the next potential leg up .
Contributing to the bullish outlook, CryptoQuant analyst İbrahim COŞAR recently highlighted Bitcoin’s successful reclaim of the 50-day Exponential Moving Average (EMA), which he described as a key level to track for short-term price trends.
Bitcoin Reclaims Key Technical Level, Eyes $120K Potential
According to COŞAR, the 50-day EMA often acts as dynamic support during corrections, and regaining this level typically precedes a price rally. In past cycles, similar conditions have led to gains between 10% to 20% shortly after the level was reclaimed.

COŞAR further noted that Bitcoin’s reclaim of the 50-day EMA occurred after a short-lived breakdown, which was quickly reversed with three consecutive daily closes above the level.
This technical setup mirrors previous instances that preceded substantial upward moves. COŞAR also cautioned that while the technical structure favors continued gains, geopolitical uncertainties , especially involving the US, Israel, and Iran, could introduce sudden volatility.
As a result, he advised market participants to avoid leveraged positions in the short term and remain prepared for potential price swings. COŞAR wrote:
That said, geopolitical developments—particularly any positive or negative news involving the U.S., Israel, and Iran—could trigger sudden volatility in BTC’s price. Please avoid using leverage during this period and remain cautious in the face of potential market swings.
Further Into Technicals: Analyst Points to Bullish Flag
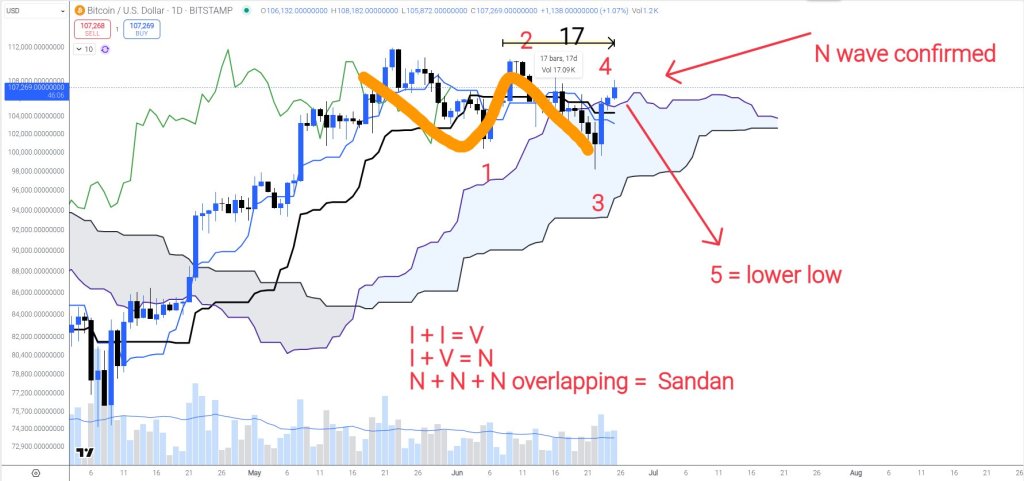
Adding to the conversation, independent crypto analyst Captain Faibik suggested that Bitcoin’s price pattern is forming a bullish flag, a common continuation pattern in technical analysis.
According to Faibik, while the structure indicates a likely breakout, a final corrective dip to the $97,000–$98,000 range may occur before upward momentum resumes .
He emphasized that a confirmed breakout above the $108,000 resistance would be a key signal, potentially setting the stage for a mid-term target of $130,000.
$BTC is currently forming Bullish flag Pattern, but there’s a chance we could see one more correction before the massive Bullish Rally begins..
I expect Bitcoin to dip towards the 97–98k zone before bouncing back towards the 108k Crucial Resistance..
Bulls need to break and… pic.twitter.com/YwOOREZTe7
— Captain Faibik
(@CryptoFaibik) June 25, 2025
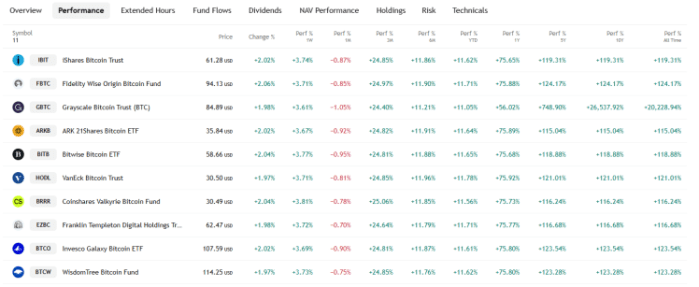
Notably, while short-term price forecasts vary, both analysts agree on the broader direction: Bitcoin remains in a bullish phase supported by technical trends . These insights align with broader market sentiment, including the increased inflow from institutional investors.

Featured image created with DALL-E, Chart from TradingView
$179,000 Or $79,000? Bitcoin Faces Critical Cycle Pivot, Says Analyst
A popular crypto analyst has issued a stark cyclical warning that could define Bitcoin’s trajectory ...
Crypto ETF Race Heats Up, More Solana ETFs Planned as Snorter Bot Corners Market for Solana Memes
The SEC’s filing cabinet has to be pretty full these days, and their ‘paperwork pending’ stack is ge...
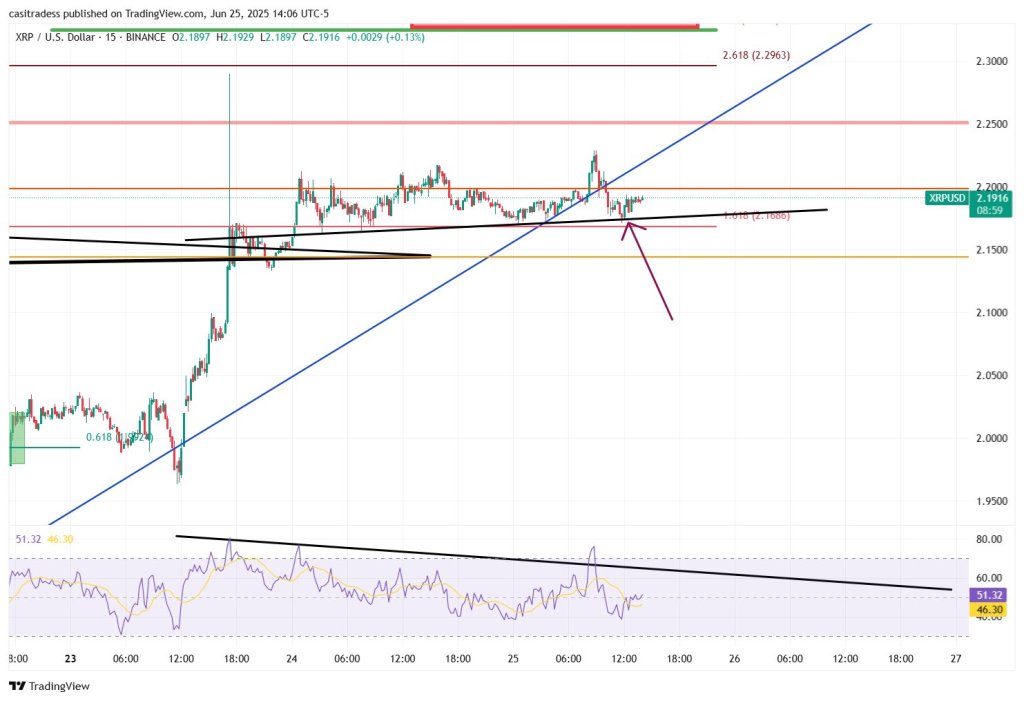
XRP Bulls On Alert—’This Trendline Is Everything,’ Says Analyst
XRP spent the past forty-eight hours coiling into a textbook inflection zone, and the 15-minute char...