XLM Crypto Price Eyes Breakout as Bullish On-Chain Signals Emerge


The post XLM Crypto Price Eyes Breakout as Bullish On-Chain Signals Emerge appeared first on Coinpedia Fintech News
The Stellar (XLM) price has shown signs of stabilizing after a bearish June, with prices attempting to reclaim the key support area. As of June 26, 2025, XLM price trades around $0.238, down by 28% from mid-May following a descending channel.
Despite the weak price action and falling XLM market cap, its TVL has grown inversely proportional. Even the derivatives data suggest rising investor confidence as XLM’s funding rate turns positive, and the weighted sentiment turning positive, clearly indicates something big is brewing in the XLM price.
Recently, Scopuly, a stellar-based DeFi wallet, posted on its official X post that the time for a breakout has arrived and projects a target of $0.46. Keep reading to know more.
On-Chain Metrics Signals A Pump Coming In XLM Price
The rise in TVL in Stellar over time reflects the increase in the demand for the project and the changing dynamics of market participation. The total TVL of Stellar was $86.7 million as per Defilama, and the surge from 2024’s low of $7.2 million displays nearly 11x in just 4 months.
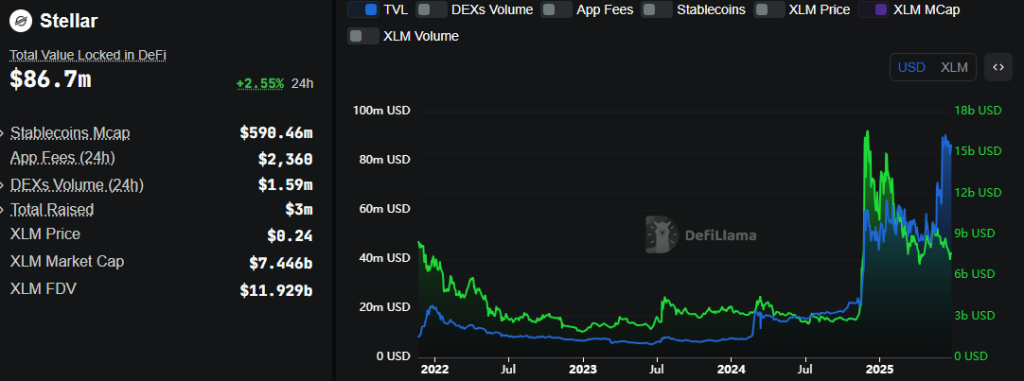
Meanwhile, from 2025’s low, it has nearly doubled, which shows that investors’ trust is rising in the project. However, its price and market cap are on a decline in the entire H1 2025.
The growth in TVL is exactly opposite to its market cap, and it seems a rise is pending for the XLM price.
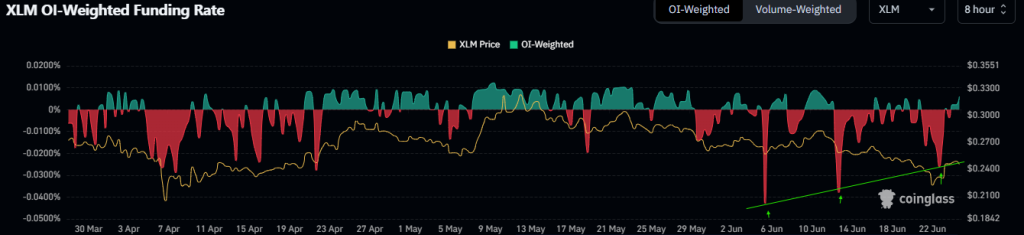
Moreover, another bullish sign for XLM has developed with its funding rates data turning positive. CoinGlass’s OI-Weighted Funding Rate data reflects that the traders expecting XLM to decrease are lower than those anticipating a price increase.
Generally, a positive rate (longs pay shorts) reveals bullish sentiment, while a negative rate (shorts pay longs) indicates bearishness
When funding rates have flipped from negative to positive and have remained positive, the odds of XLM price rising in the short term have jumped.
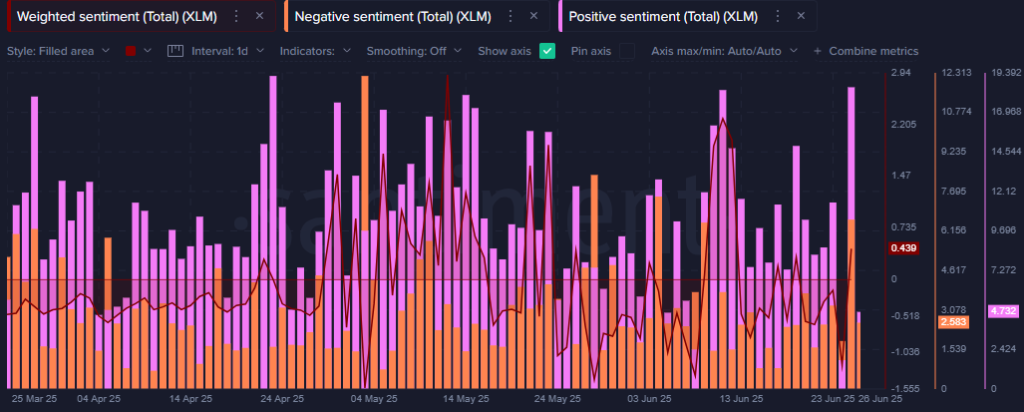
This bullish sentiment is further supported by Santiments’ weighted sentiment, which has turned bullish when XLM price took support at a level based on the “FR volume profile” tool near $0.225.
Clearly highlighting that the intensity of negative emotion is also relatively lower than positive emotions, as a result, it has spiked.
Additionally, Dune analytics reveals that it has been utilized a lot lately, which could be seen by its active addresses that highlight that active addresses MoM is rising, where active users by May were 263.25K, while recurring addresses were 173.67K, and new addresses were 89.59K.
Can XLM Price Break Bearish Structure?
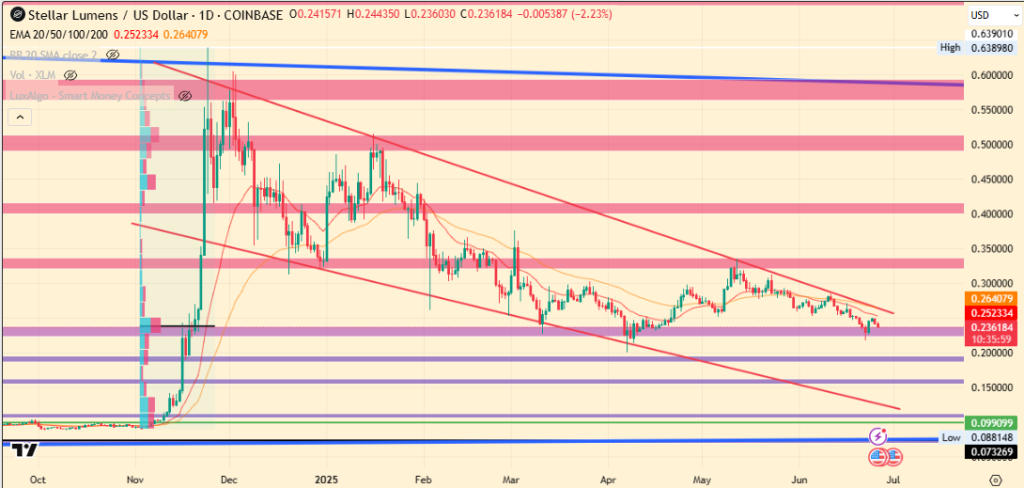
The XLM price has been trapped in a falling channel, which has drained investor morale. However, it has reached a critical level where it previously rallied in Q4 2024.
Rising on-chain data and XLM’s ability to hold multi-month support suggest a potential price rally is on the horizon. Currently, XLM is trading near the channel’s upper border for nearly 45 days, indicating that the pattern is strongly followed and its breach will trigger a breakout.
If the upper border is breached, XLM could retest the $0.40 mark in the short term. Conversely, if support is lost, the price may decline to the $0.15 level.

Bitwise Amends S-1 Filings for Spot Dogecoin ETF and Aptos ETFs: Approvals on Track?
The post Bitwise Amends S-1 Filings for Spot Dogecoin ETF and Aptos ETFs: Approvals on Track? appear...
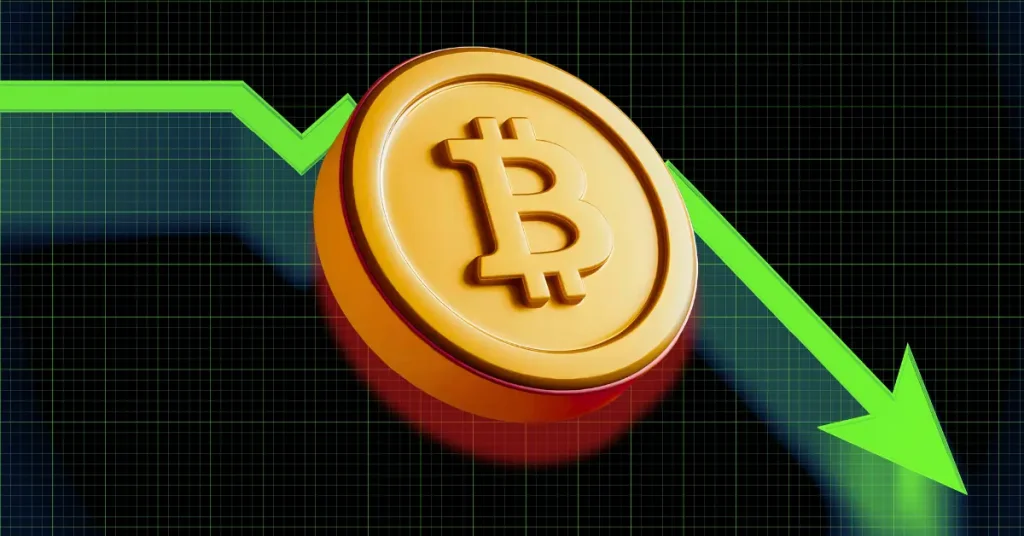
Top Reasons Why Bitcoin Price May Retest $92k First Before Reaching $120k in the Midterm
The post Top Reasons Why Bitcoin Price May Retest $92k First Before Reaching $120k in the Midterm ap...
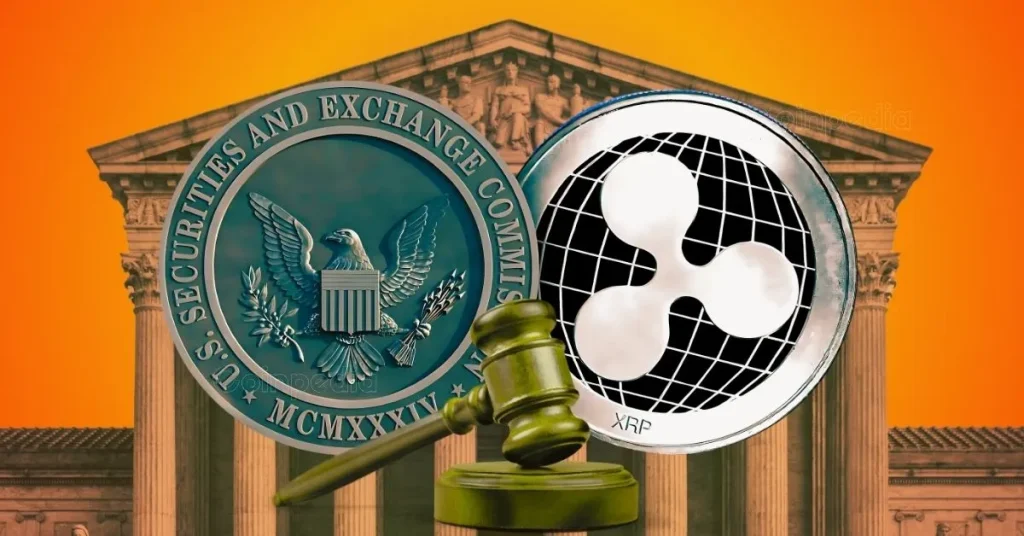
XRP Lawsuit News: Judge Halts $50M Ripple-SEC Deal
The post XRP Lawsuit News: Judge Halts $50M Ripple-SEC Deal appeared first on Coinpedia Fintech News...