XRP Gears Up For Major Move — Chart Signals Are Clear


XRP is showing all the signs of a move brewing, and the chart doesn’t lie. After a period of consolidation, price action is tightening, and technical indicators are flashing signals of an impending move. Whether it’s a surge to the upside or a sharp reversal , the setup is in place, and momentum is building. XRP looks loaded and ready to make its next move.
Volume Remains Subdued — Calm Before The Storm?
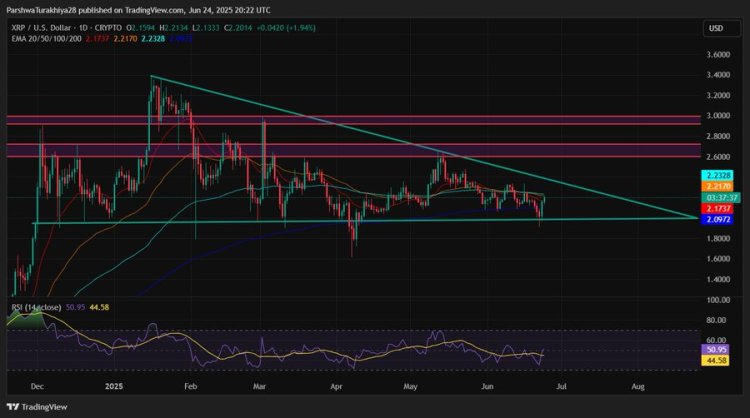
XRP price remains trapped inside a long-standing triangle, a pattern known for building pressure before sharp directional moves. The chart shows that sellers continue to push lower highs, compressing price action toward a support level.
Parshwa Turakhiya pointed out on X that the Exponential Moving Average (EMA) cluster between $2.17 and $2.23 is the key breakout zone capping any upward momentum. A clean break above this range could trigger a bullish reversal. On the other hand, $2.09 is the last line of defense for the bulls. If this level fails , the structure breaks down, and XRP could swiftly drop to $1.85.
Despite the building tension, the Relative Strength Index (RSI) remains neutral, which Parshwa Turakhiya describes as “the calm before the volatility storm.” The chart structure suggests that a move is imminent. With early July just ahead, Parshwa Turakhiya warns that a breakout or breakdown is coming, and it won’t be subtle. XRP is on the edge of eruption.

Fabio Zuccara stated that Dr. Profit, known for his sharp and historically accurate calls on XRP at $0.15, $0.38, and $0.50, has now projected a new mid-term target of $4.00. In a weekly chart shared via social media, XRP is forming a bullish structure, with a green arrow projecting a continuation move to the upside.
Zuccara outlined a crucial level for maintaining the bullish trajectory. This rebound adds strength to the outlook, suggesting that momentum is building in favor of the bulls .
In the same vein, SquirtleCharts revealed that XRP’s 4-hour chart has mapped out a precise path toward $3.00 target, with several resistance levels standing in the way, and each level varies in difficulty. The first is $2.22, the easy one, a weak resistance point that XRP could clear without much effort.
Next is $2.33, which SquirtleCharts labels as “a lot harder,” signaling a barrier that may require volume and conviction to break. The $2.48 level is “not too bad,” a moderate resistance area that might slow the rally but not be a roadblock. Finally, the $2.65 is the “pretty hard,” a zone where bulls may face challenges.
Perfect Technical Structure Sets Stage For Explosive Breakout
Massive move incoming for XRP. After a clean bounce off the $2.00 support level, the setup is aligning perfectly on the daily chart.
Sara emphasizes that the chart structure looks flawless, with price action respecting critical zones and now coiling for an explosive breakout, with momentum building and bulls defending the support zone. The next target is $3.50; a breakout might happen fast.


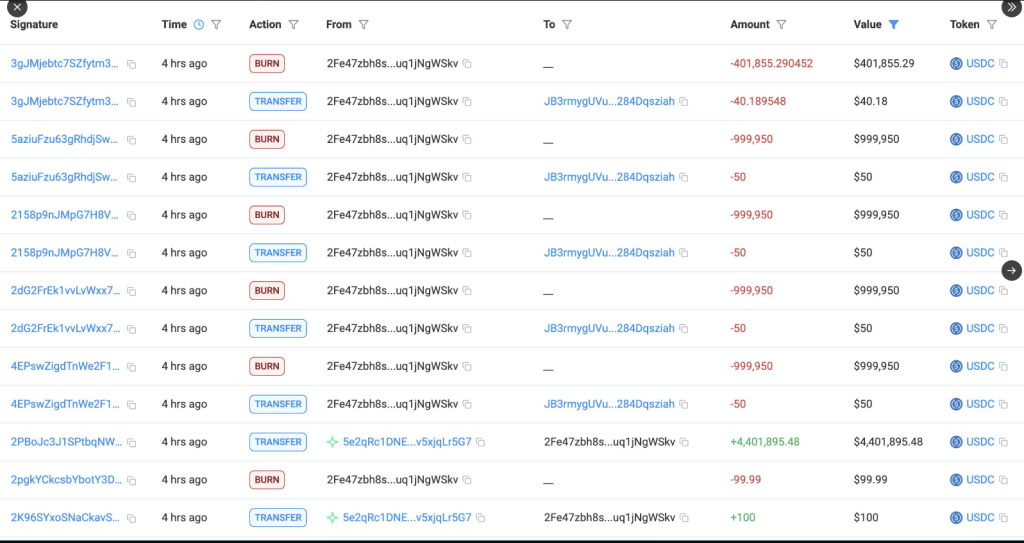
TRUMP Token In Trouble? Over $4 Million Liquidity Exit Sparks Crash Fears
US President Donald Trump’s namesake meme token has tumbled hard, slumping nearly 90% from its all-t...

XRP Price Under Pressure — Can It Maintain The Bullish Structure?
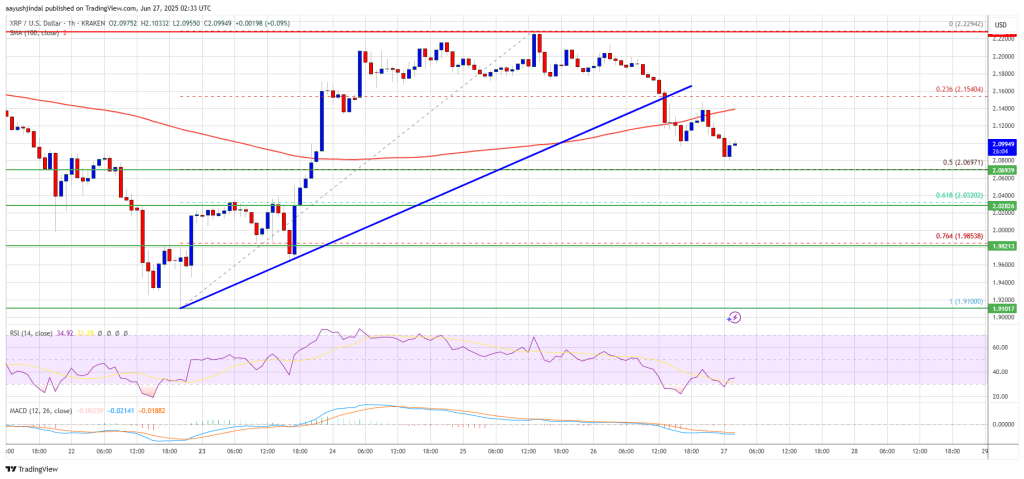
XRP price started a downside correction from the $2.220 zone. The price is consolidating and might d...

Ethereum Price Action Turns Bearish — Risk of Near-Term Correction
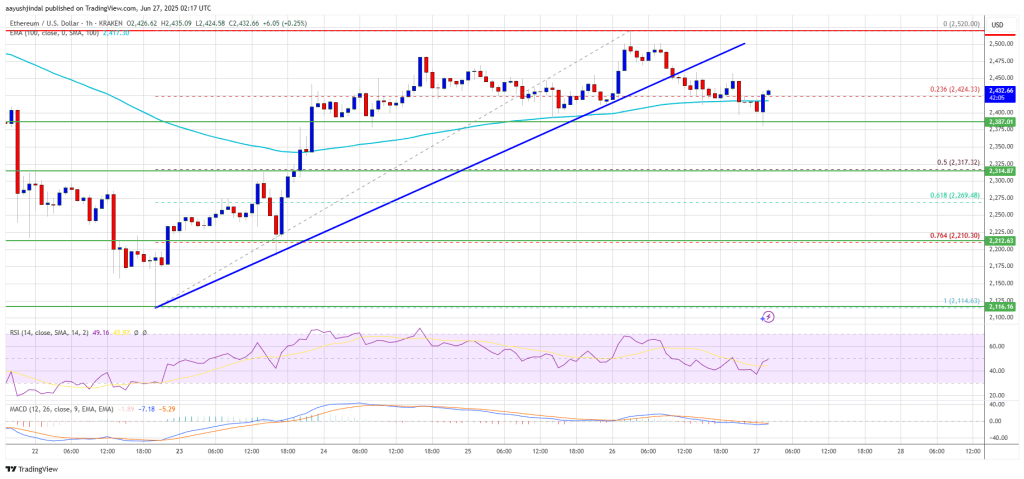
Ethereum price started a fresh increase above the $2,450 zone. ETH is now correcting gains from $2,5...

